Classic APEX reports can break and sum on up to three column values. This is done by utilizing the Break Formatting section of the Report Attributes tab to define the columns we wish to break (and subtotal) by
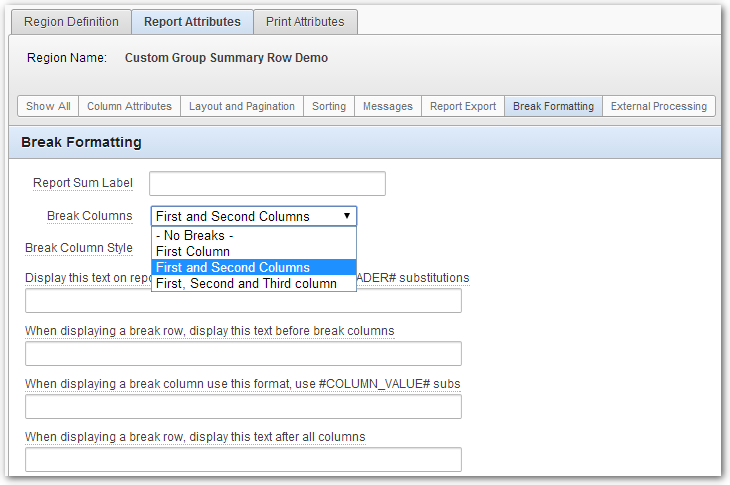
and then by placing a check in the Sum column for the columns we want to total.
The default break and sum labels are fairly basic.
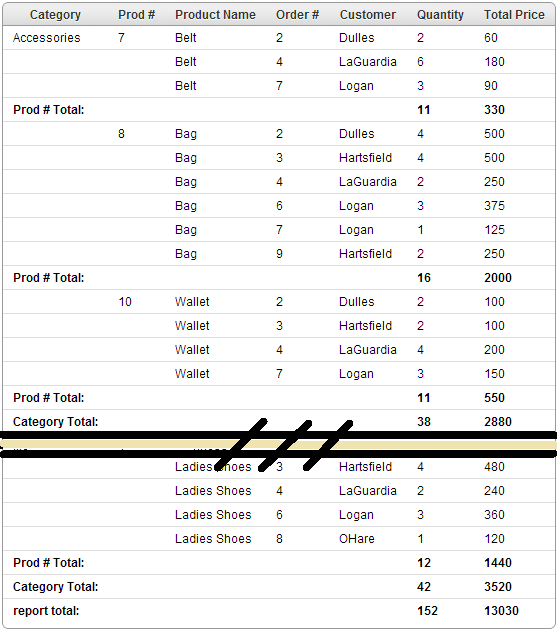
For column breaks it will show us the report column header text with "Total:" appended afterwards. For the report total we are shown "report total:". These labels can be generically modified by using the fields in the Break Formatting section of the Report Attributes.
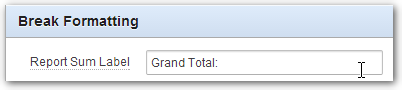
For example, we can replace the "report total:" label by placing "Grand Total:" in the "Report Sum Label" field.
We can further customize the column break (subgroup) labels and rows by using some jQuery (JavaScript).
Suppose we want to have the group label show the value of the column field and not just the header text; and we want to highlight the different column break rows with different colors.
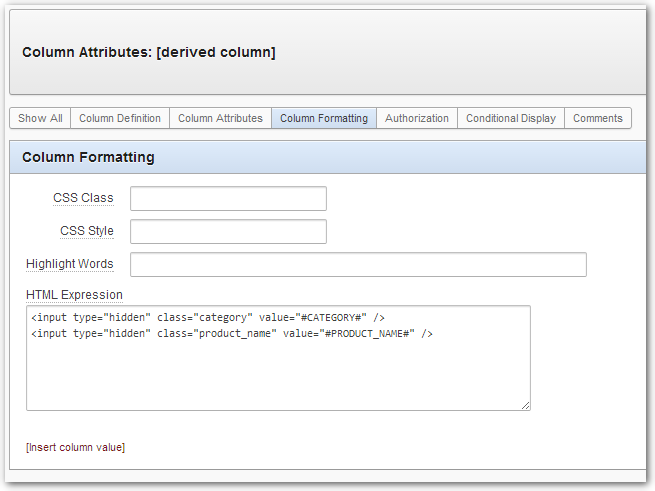
First, we will add a derived column to our report which will include some HTML hidden items to store the column values that we can reference in our jQuery code. We will put the following code in the "HTML Expression" field of our derived column:
<input type="hidden" class="category" value="#CATEGORY#" />
<input type="hidden" class="product_name" value="#PRODUCT_NAME#" />
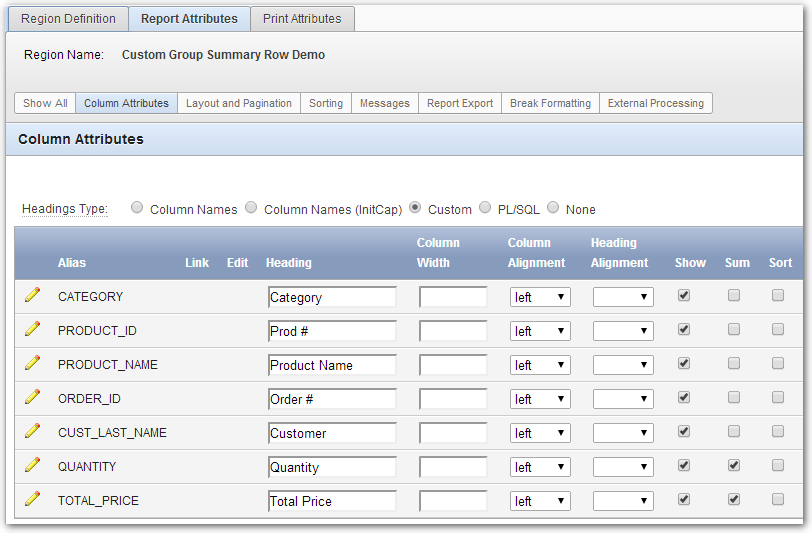
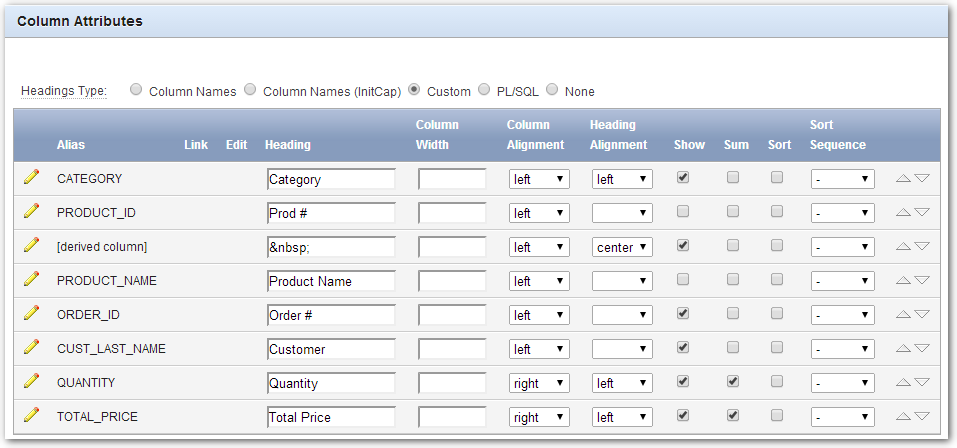
We will apply the changes to our derived column and move down to the 3rd position of the report columns. We need to move the derived column down since our report is breaking on the first two columns. We are also going to not "show" the product_id and product_name columns. Our column attributes including our derived column look like:
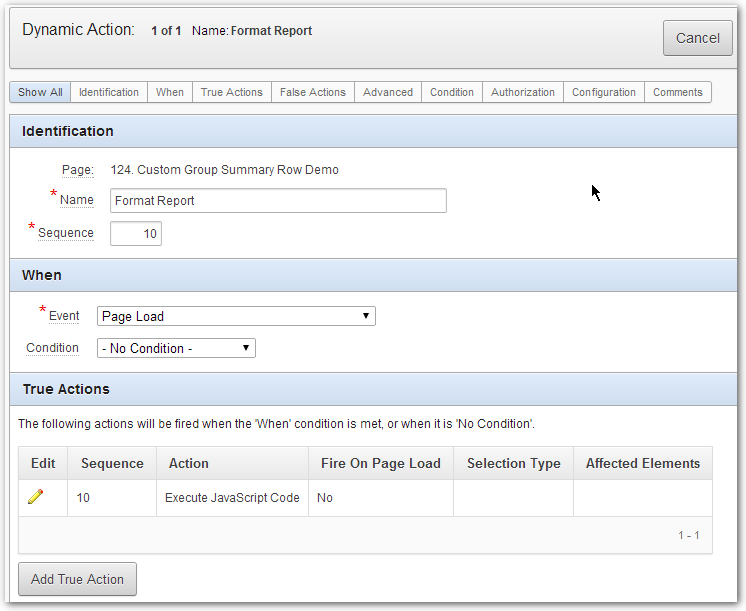
Now we need to add our jQuery code to format our report. The jQuery code can be added to the page attributes in the "Execute when Page Loads" field but in this case we will add it to a Dynamic Action. Why a dynamic action? First, I find it easier to recognize that I have some custom javaScript on my page if when I see Dynamic Actions when viewing all the page components from the page definition page. Second, if we ever enable partial page refresh of this report we will need a dynamic action to run our code whenever the report region is refreshed.
To add our code we create a Dynamic Action with the event set to "Page Load". Then add a true action of "Execute JavaScript Code".
We add the following the true action code:
$("td.data[headers='QUANTITY']").css("background-color","#EAEAEA");

$("td.data[headers='TOTAL_PRICE']").css("background-color","#D4FFBF")

$("td.data[headers='CATEGORY'] b:contains('Prod # Total:')")
   .text("")
   .closest("tr").find("td").css("background-color","#FFFFA3")
   .parent().find("td:nth-child(2)")
   .text(function(){
           return(
             $(this).parent()
                    .prev()
                    .find("input.product_name").val()
                  + " subtotal:" );
         }
    )
   .css("font-weight","bold");


$("td.data[headers='CATEGORY'] b:contains('Category Total:')")
  .closest("tr").find("td")
    .css("background-color","#7BC5EA")
    .css("border-bottom-width","10px")
    .css("border-bottom-color","#000033")
  .parent().find("td:first")
  .text(function(){
          return(
            $(this).parent()
            .prev()
            .prev()
            .find("input.category").val()
          + " overall:" );
        } )
  .css("font-weight","bold");
Line 1: Set the background color of all the Quantity cells.
Line 3: Set the background color of all the Total Price cells.
Lines 5-17: The jQuery code to format and change the product summary row. This also demonstrates how jQuery chaining is used to navigate to different elements from currently selected elements.
Line 5: Find all the Category cells that have "Prod # Total:" in them (the product summary rows).
Line 6: Clear the text in the cell (we are going to put the label in a different cell).
Line 7: Select the cell's row and find all the cells in that row and set the background color.
Line 8: Go back to the row and find the 2nd cell
Lines 9-16: Set the cell text by finding the value of the product hidden item in the previous row
Line 11: Select the cell's row
Line 12: Go to the previous row
Lines 13-14: Find the input element with the product_name class and get it's value and append "subtotal:" to it.
Line 17: Make the label bolded.
Lines 20-34: The jQuery code to format and change the category summary row.
Line 20: Find all the Category cells that have "Category Total:" in them (the category summary rows).
Line 21-24: Select the cell's row and find all the cells in the row set the background color and add a border on the bottom.
Line 25: Go back to the row and find the 1st cell
Lines 26-33: Set the cell text by finding the value of the category hidden item in the previous detail row.
Line 28: Select the cell's row
Line 29: Go to the previous row (the product summary row).
Line 30: Go to the previous row (the detail row)
Lines 31-32: Find the input element with the category class and get the value and append "subtotal:" to it.
Line 34: Make the label bolded.
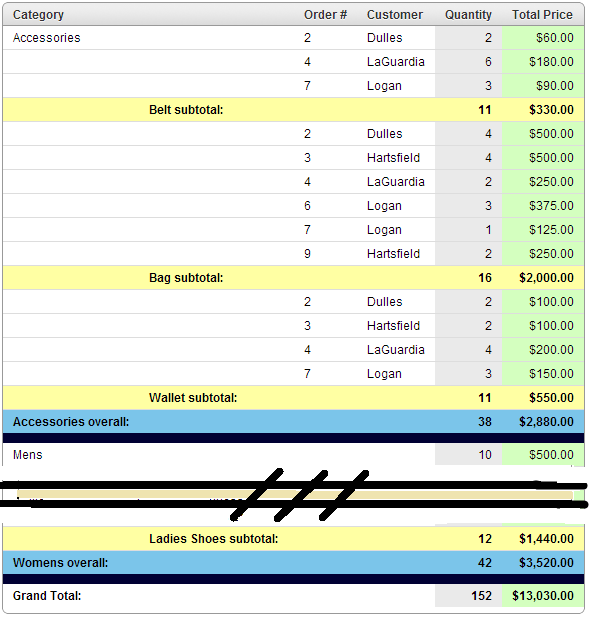
Our final report will look something like:
This post is another example of the various methods that can be used to customer the look and feel of Oracle APEX classic reports.
Note: For a quick look use these example links: Before and After